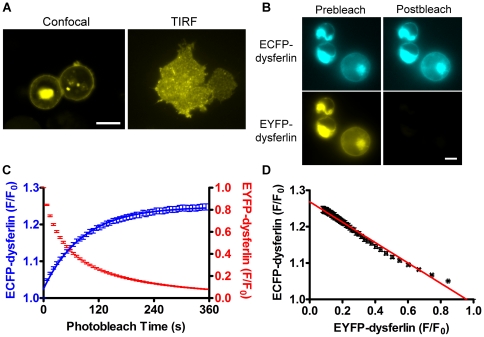
Figure 2. Dysferlin self-interaction in living HEK293 cells shown by acceptor-selective photobleaching FRET assay.
(A) Confocal microscopy and total internal reflection fluorescence (TIRF) microscopy images of YFP-dysferlin expressed in HEK293 cells. Scale bars: 10 µm. (B) CFP-dysferlin and YFP-dysferlin fluorescence images before (Prebleach) and after (Postbleach) YFP-selective photobleaching. Scale bar: 5 µm. (C) Quantitative analysis of CFP-dysferlin and YFP-dysferlin fluorescence intensities (F/F0) during YFP-selective photobleaching. (D) The relationship between the normalized fluorescence of CFP-dysferlin and the normalized fluorescence of YFP-dysferlin during progressive photobleaching was linear, consistent with a homodimeric dysferlin complex.

