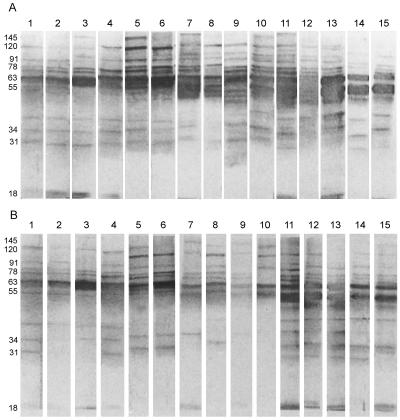
FIG. 2.
Western blot analysis of kala-azar serum IgG reactivity with SDS-PAGE-separated (6-μg) membrane proteins of LAg before (A) and after (B) SAG treatment. Each lane represents one VL patient, and longitudinal samples have identical lane numbers. The apparent molecular masses of prominent bands in kilodaltons are marked on the left.

