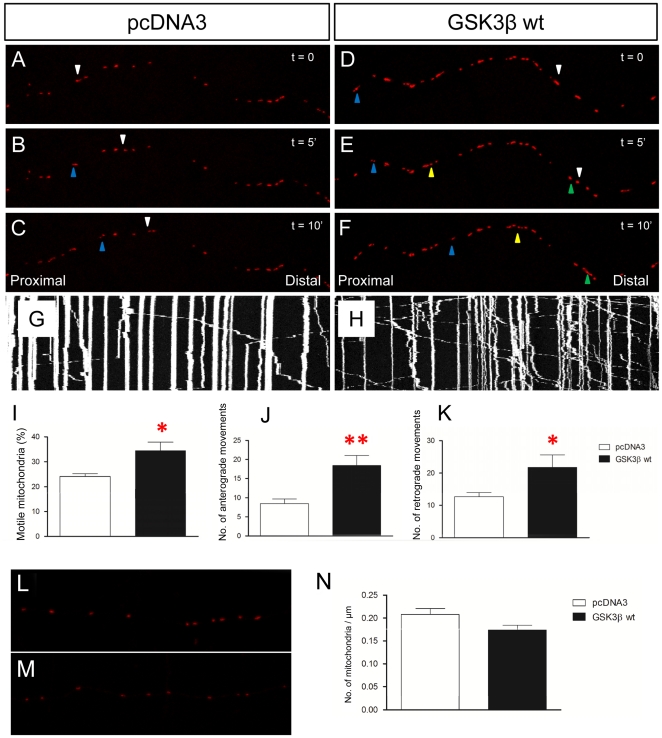
Figure 1. GSK3β overexpression increases the percentage of motile mitochondria.
A–F: Representative images of primary cultured neuron axons showing the movement of some mitochondria. Motile mitochondria are indicated with colored triangles. Time interval between photographs is 10 seconds. GSK3β wt transfection increases the percentage of motile mitochondria (D–F) compared to pcDNA3 transfection (F1,18 = 4.117; p = 0.046) (A–C). Blue, yellow and green triangles label different individual motile mitochondria respectively. G–H: Representative kymographs of pcDNA3- (G), GSK3β wt- (H) transfected axons respectively. I: Quantification of the percentage of motile mitochondria. J–K: Number of anterograde (J) and retrograde (K) movements is increased after GSK3β transfection (Anterograde: F1,20 = 9.398; p = 0.006) (Retrograde: F1,20 = 4.114; p = 0.049). L–N: The number of mitochondria was quantified in several axonal segments and normalized by dividing the number of mitochondria by the length of the axon. L–M: Representative images of MitDsRed in pcDNA3 (L), GSK3β wt (M) transfected primary cultured neurons. N: Quantification of the number of mitochondria per axonal length unit. Red asterisk: * 0.05>p≥0.01; ** 0.01>p≥0.001.

