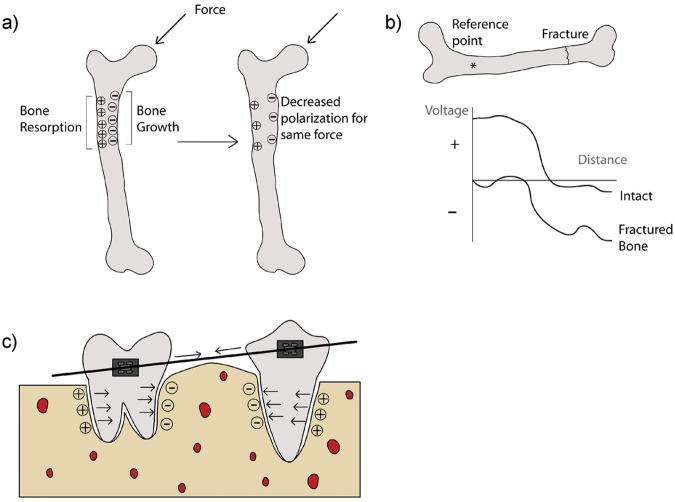
Figure 2.
Schematic of: (a) polarization of bone under applied mechanical forces; (b) voltage vs. distance comparison between intact and one-hour post-fracture bones; and (c) simplified mechanical forces and respective polarization of bone and periodontal ligament under orthodontic treatment. Adapted from Black (1986).

