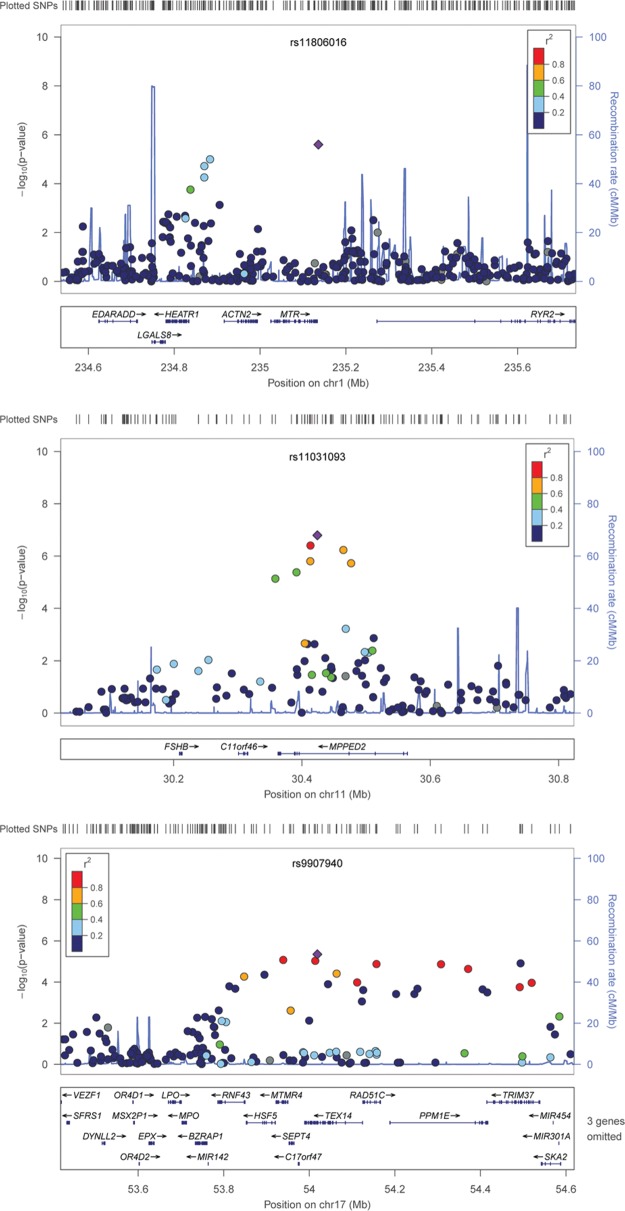
Figure 2.
Nominated loci of interest. Association results from the GWAS for 3 suggestive loci. Top panel: suggestive locus near ACTN2, MTR, and EDARADD genes on chromosome 1. Middle panel: suggestive locus near MPPED2 on chromosome 11. Bottom panel: suggestive locus near LPO on chromosome 17. Negative log10-transformed p-values and physical positions for SNPs in the region are shown. Colors indicate linkage disequilibrium between the top SNP (diamond) and other SNPs based on HapMap CEU data. The rug plot indicates regional SNP density. The recombination rate overlay is based on HapMap CEU data. Gene positions and directions of transcription are annotated.

