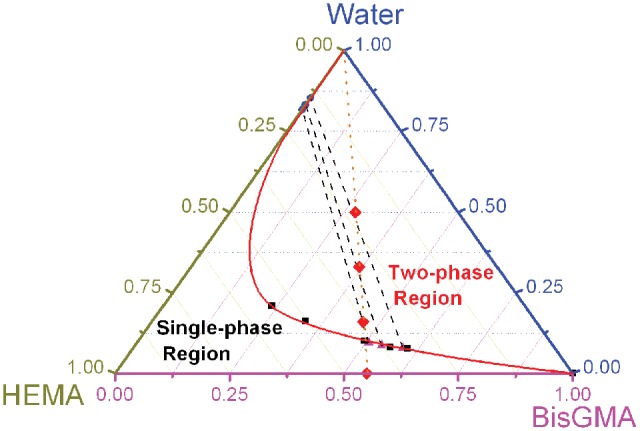
Figure 2.

Partial phase diagram for ternary mixtures comprised of water, BisGMA, and HEMA. Filled circles and triangles represent experimental phase partitioning datapoints, and dashed lines represent experimental tie lines. Extra filled squares represent data previously collected by the ‘cloud point’ method (Spencer and Wang, 2002; Ye et al., 2008, 2009b). Note that the solid phase boundary line, drawn as a binodal curve, is only for demonstration, because only a portion of this line corresponds to experimental observation. The dotted line represents all the initial compositions with mass ratio of BisGMA/HEMA fixed at 55/45 and goes through the maximum single-phase water content (10.1%) and also the 3 filled diamonds (representing the initial compositions with water fraction at 16%, 33%, and 50% investigated in this work).
