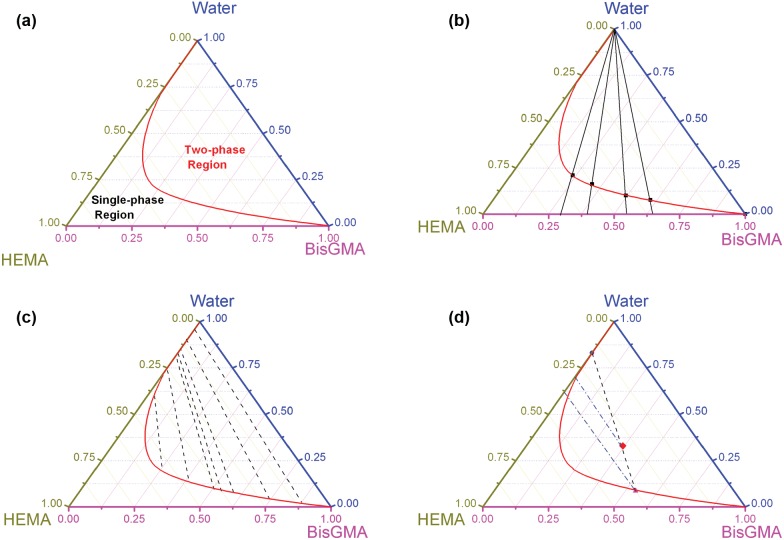
Figure 3.
Information provided from a ternary phase diagram of the BisGMA/HEMA/water system. (a) Prediction of liquid/liquid phase separation for any given overall system composition; the binodal curve separates the single-phase region from the two-phase region. (b) Prediction of maximum single-phase water content at any ratio of BisGMA/HEMA resin; straight mass fraction changing lines connected with the specific point on the bottom axis corresponding to the specific ratio of BisGMA/HEMA. (c) Prediction of each phase composition when liquid/liquid phase separation occurs. (d) Partition ratio of each component between water-rich and BisGMA-rich phases and degree of phase separation. A 60o line drawn through the origin represents equal distribution of HEMA.

