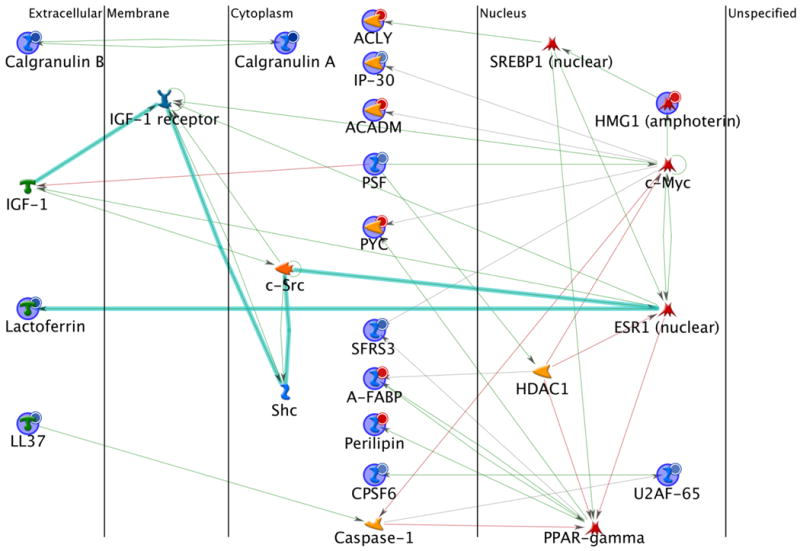
Figure 6.

Protein interaction network of differentially expressed lymph node proteins between the DeGussa P25 TiO2 nanoparticles treated and the control mice. Network analysis was performed using the MetaCore program via the shortest paths algorithm for all the 33 differentially expressed proteins. As a result, 15 proteins were included in this map. The lines between the gene (protein) symbols show different effects between up- and down-streams: inhibition (pink lines), activation (green lines), unspecified (grey lines) and fragments of canonical pathways (thick cyan lines). Up-regulated proteins are marked with red circles and down-regulated with blue circles.
