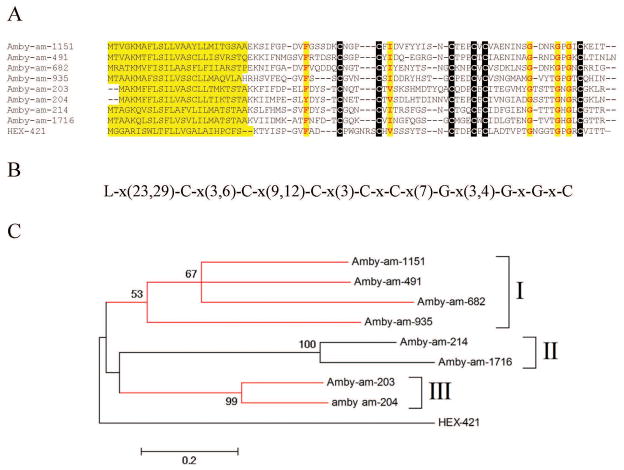
Figure 7. The AmbHy9 kDa family of Amblyomma and Hyalomma.
A Clustal alignment showing the signal peptide region and a conserved amino acid framework. B Conserved cysteine, glycine, and hydrophobic amino acids framework. C Phylogram derived from the alignment in A showing three Amblyomma americanum clades (I–III). The numbers on the branches represent percent bootstrap support (less than 50% are omitted). The Amblyomma sequences derive from deducted expressed sequence tags from available at DBEST and were described in a previous review [3]. The bar at the bottom indicates 20% amino acid divergence. For more detail, see text.

