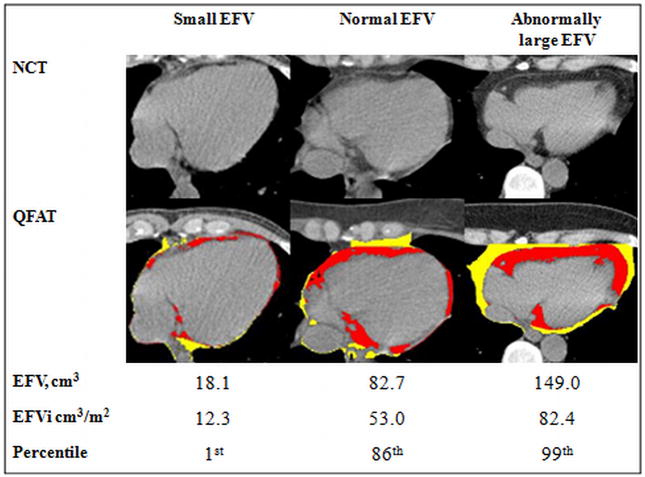
Figure 3. Examples of NCT scans and the corresponding EFV, EFVi, and percentiles of EFVi of patients with small, normal and abnormally high EFVi values.
Legends: EFVi epicardial fat volume indexed to body surface area; NCT– non-contrast enhanced cardiac computed tomography; QFAT– quantification of epicardial fat software (Cedars-Sinai Medical Center, Los Angeles, CA, USA); Red area– epicardial fat; Yellow area– thoracic fat

