Fig. 2.
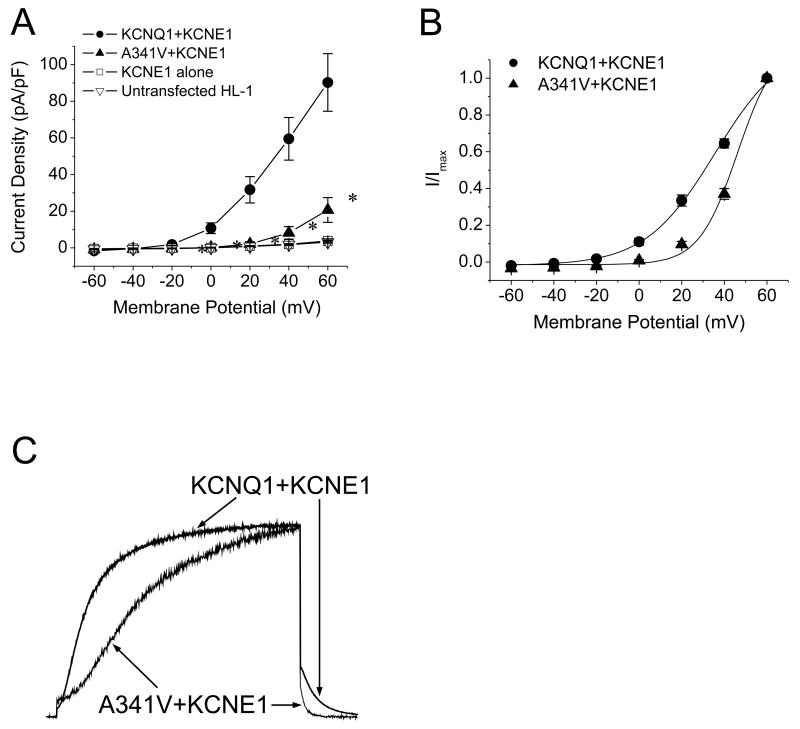
Electrophysiological comparison between wild type KCNQ1+KCNE1 and A341V+KCNE1. A. Current-voltage relationships of KCNQ1+KCNE1 and A341V+KCNE1. Current amplitudes were normalized to cell capacitance to yield current density (n=8-11/group). The current densities obtained from untransfected HL-1 cells and cells transfected with KCNE1 alone are also depicted (n=7-8/group). Significant differences were observed between the A341V+KCNE1 and KCNQ1+KCNE1 groups (P < 0.01 versus KCNQ1+KCNE1). B. Voltage dependence of activation of KCNQ1+KCNE1 and A341V+KCNE1. The isochronal activation curves were fitted with the Boltzmann equation as described in Materials and methods (n=8-11/group; Table 1). C. Comparisons of current activation and deactivation kinetics between A341V+KCNE1 and KCNQ1+KCNE1. Currents were monitored during a test pulse to +60 mV from a -50 mV holding potential, peak-adjusted, and superimposed. The activation and deactivation parameters are summarized in Table 1.

