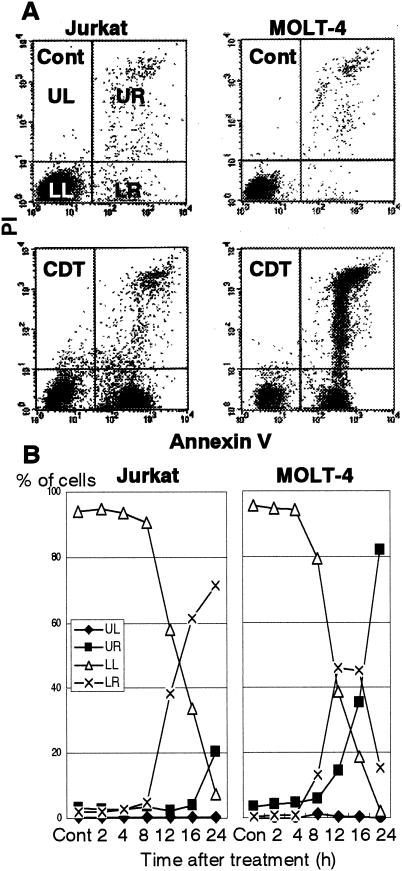
FIG. 2.
Cytolethal kinetics on CDT-treated cell lines. T-cell leukemia cell lines Jurkat and MOLT-4 were treated with CDT (100 ng/ml) for various times. Cells stained with FITC-labeled annexin V and PI were analyzed by flow cytometry. (A) Representative results for cells with or without treatment of CDT at 16 h. Cont, control. (B) Kinetics of cell death measured at indicated times after CDT treatment. The percentages of cell populations in the UL quadrant (annexin V− PI+, ♦), the UR quadrant (annexin V+ PI+, ▪), the LL quadrant (annexin V− PI−, ▵), and the LR quadrant (annexin V+ PI−, ×) are indicated.

