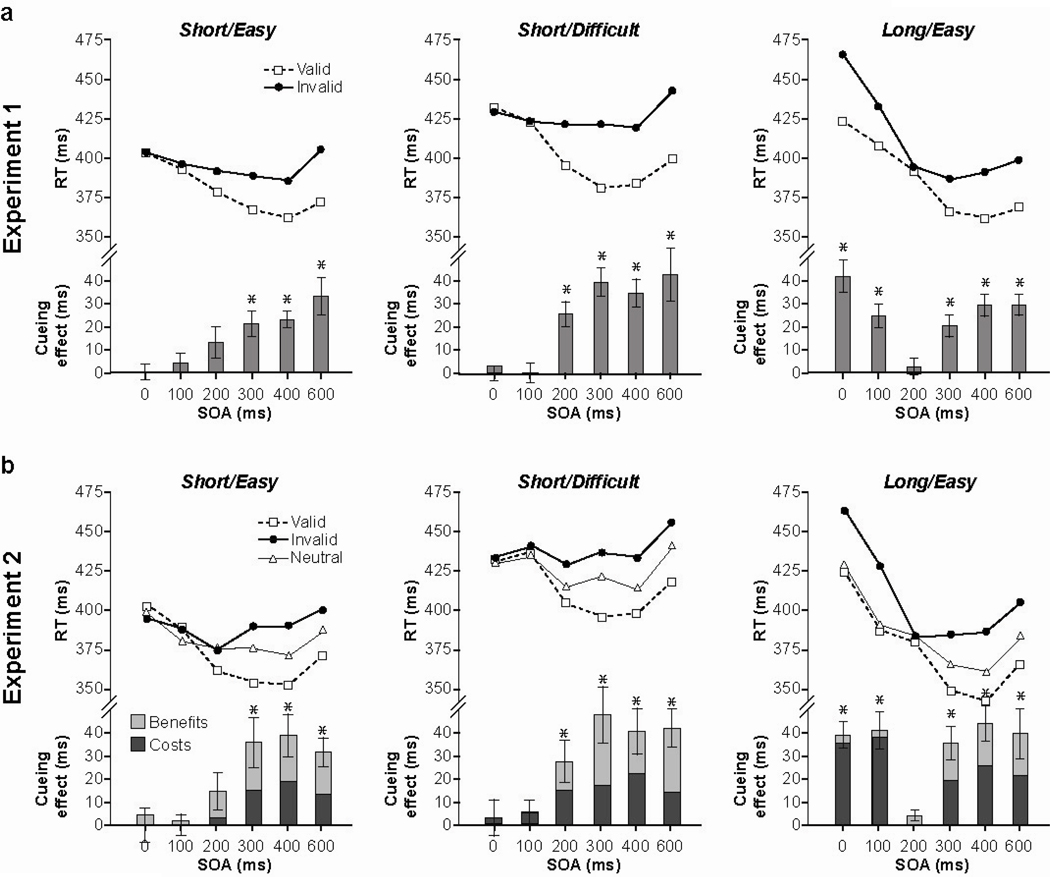
Figure 2.
Mean response times (RTs) and cueing effects plotted as a function of SOA for (a) Experiment 1 and (b) Experiment 2. Line graphs in the top of each panel display mean RTs for validly and invalidly cued targets (and neutrally cued targets in Experiment 2), for the short-duration/easy (left graph), short-duration/difficult (middle graph), and long-duration/easy (right graph) conditions. Bar graphs in the bottom of each panel depict the cueing effect (invalid-minus-valid RTs). For Experiment 2, the overall cueing effect is separated into costs (invalid-minus-neutral RTs; dark shading) and benefits (neutral-minus-valid RTs; light shading).

