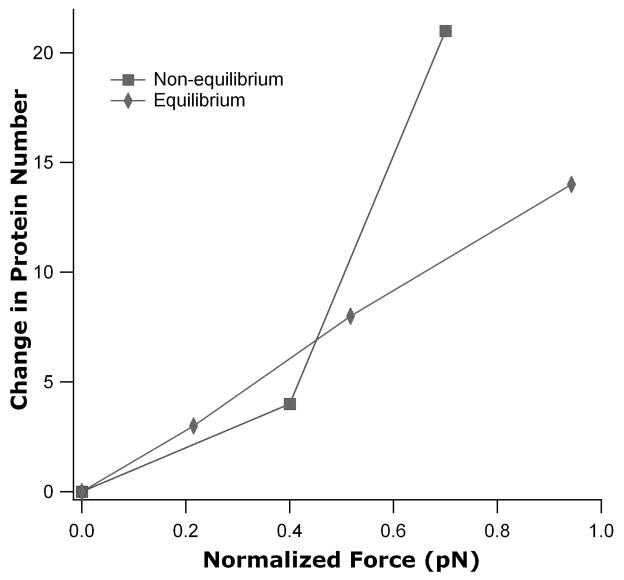
Figure 4.
Plot of change in protein number versus normalized force for equilibrium (diamonds) [12] and non-equilibrium (squares) conditions. The change in protein number was also normalized to be zero for the first data point in this illustration and the DNA length for the non-equilibrium data was normalized to 6 kb.

