Fig. 5.

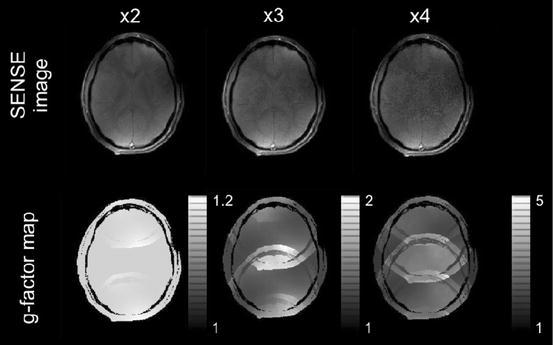
Parallel imaging with the four-element C2ONTAR–CSA array (analog to Fig. 3) in vivo. Top, from left to the right: SENSE images recorded with the undersampling factor of 2, 3.2 and 4. Bottom corresponding g-factor maps

Parallel imaging with the four-element C2ONTAR–CSA array (analog to Fig. 3) in vivo. Top, from left to the right: SENSE images recorded with the undersampling factor of 2, 3.2 and 4. Bottom corresponding g-factor maps