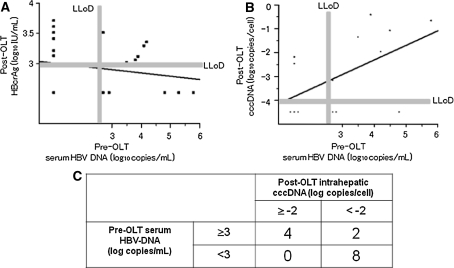
Fig. 5.
Correlation between pre-OLT serum HBV-DNA and post-OLT HBcrAg (a), and pre-OLT serum HBV-DNA and post-OLT HBV cccDNA (b). A linear correlation was observed in b (r = 0.534, P < 0.05), but not in a. All eight patients (100%) with serum HBV-DNA <3 log10 copies/mL at the time of OLT showed post-OLT cccDNA <2 log10 copies/cell, significantly higher than the rate of 33% found in patients with higher HBV-DNA levels (two of six patients) (P < 0.003) (c)

