
Fig. 1.
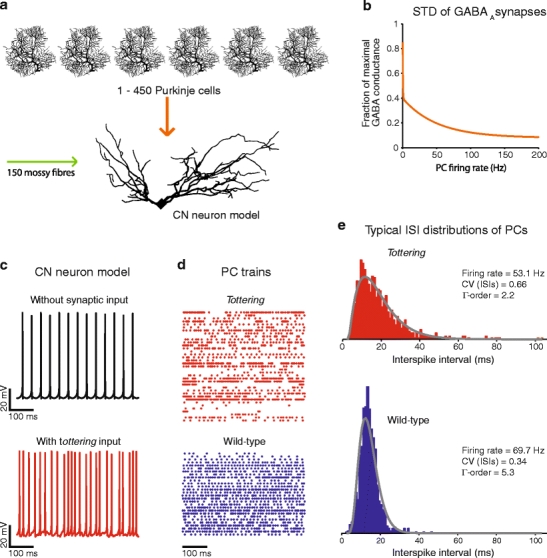
Overview of the simulation setup. a The CN model received excitatory input from 150 mossy fibres, modelled as spike generators with a mean firing rate of 20 Hz. Purkinje cell (PC) input to the CN model was provided by 1–450 independently firing spike generators. In the study with Purkinje cell trains recorded from tottering and wild-type mice, the input comprised 1–150 individual trains. b Dependence of STD at the Purkinje cell to CN neuron synapse on Purkinje cell firing rate as modelled by [19]. c Membrane potential traces of the CN model. Top panel the model was tuned to fire at approximately 26 Hz in the absence of synaptic inputs. Bottom panel typical response to Purkinje cell spike trains from tottering mice (convergence ratio 150, +STD). d Spike raster plots showing 500 ms samples from each of the tottering (n = 37) and wild-type (n = 28) Purkinje cell recordings. e ISI distributions of two representative 15-s Purkinje cell trains used in the simulations. Grey curves are fits to gamma distribution functions (see “Materials and Methods” section)