
Fig. 3.
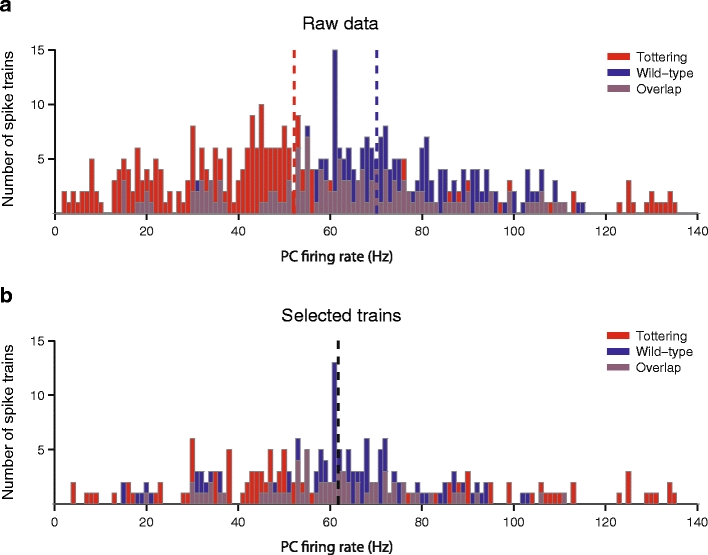
Firing rate distributions before and after the selection of sets of trains with identical mean rates. a Distribution of spike rates for the original set of 326 tottering and 251 wild-type trains divided into 15-s stretches. The dashed lines indicate the different mean rates of tottering (red) and wild-type (blue) trains before selection. b Spike rates of one of 204 selected sets of 150 15-s trains from tottering and wild-type Purkinje cells, with a mean rate of 61.8 Hz for both tottering and wild type (black dashed line)