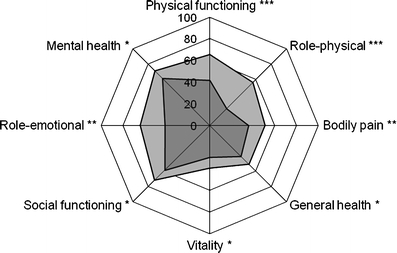
Fig. 1.

The SF-36 subscale mean scores among employed and unemployed patients. The SF-36 subscales differed significantly between employed (light grey) and unemployed (dark grey) patients. Independent samples t test; *** p < 0.001, **p < 0.01, *p < 0.05
