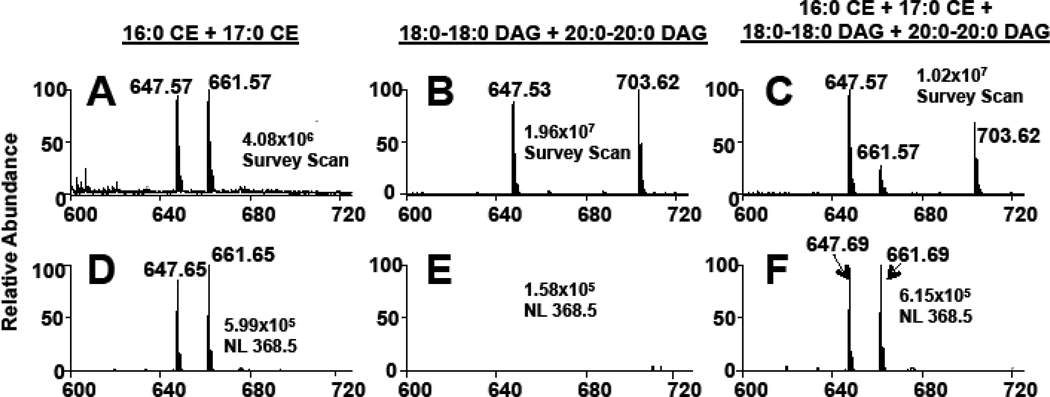
Figure 3.
MS and MS/MS analyses of CE and DAG sodiated adducts. 16:0 CE (m/z 647) and 17:0 CE (m/z 661) (A and D), 18:0-18:0 DAG (m/z 647) and 20:0-20:0 DAG (m/z 703) (B and E), and a mixture of both CE and DAGs (C and F) (all lipids present at a concentration of 5 µM) were subjected to direct-infusion ESI-MS analysis. Panels A–C are survey scans of each lipid mixture over an m/z range of 600 – 725 for five min. Panels D–F are scans for the neutral loss of 368.5, which were acquired for three min. The collisional energy for the MS/MS analysis of the CE molecular species was 25 eV. The NaOH added prior to ESI analysis was 10 µM.

