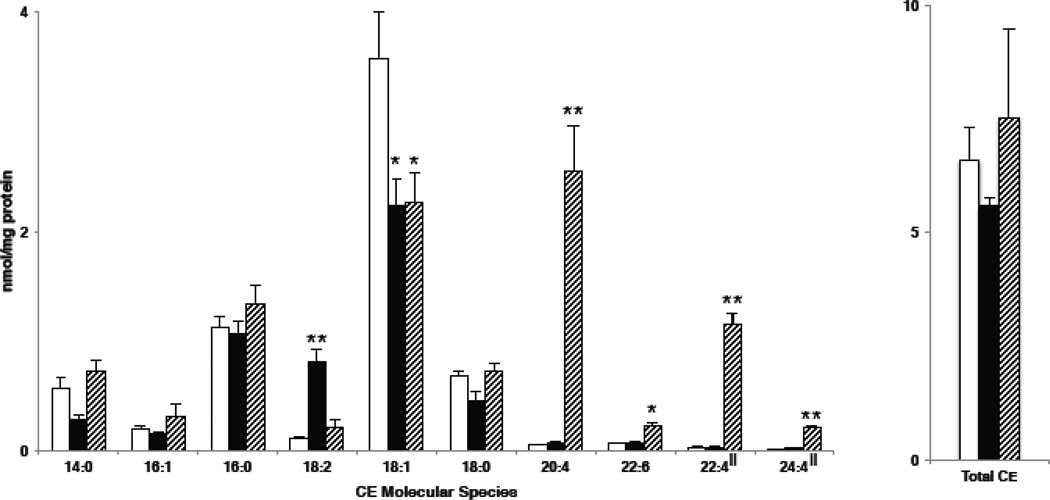
Figure 5.
CE molecular species present in J774 cells. J774 cells were cultured in the presence of either no fatty acid supplementation (open bars), linoleic acid supplementation (black bars) or arachidonic acid supplementation (hatched bars). At the end of the cell culture treatment interval, lipids were extracted from J774 cells with 17:0 CE added as an internal standard, and were subsequently subjected to ESI-MS using NL 368.5 scanning as described in detail in “Materials and methods”. Values are the means + S.E.M. for n = 3. All values were corrected by calibration constants in Table 1 with the exception of those indicated (‖), which were corrected with the response factor (slope) of the corresponding shorter chain fatty acid with the same degree of unsaturation. For example, 22:4 and 24:4 CE were corrected using the 20:4 response factor. These elongated CE molecular species were not available to derive response curves.

