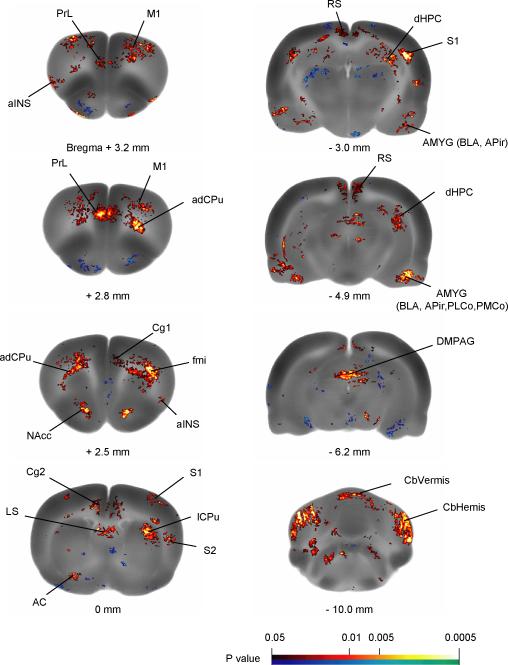
Figure 3. Key brain regions showing significant differences in regional cerebral blood flow between the conditioned and the control rats.
Statistical parametric mapping (SPM) results contrasting the conditioned group to the control group show differences in regional cerebral blood flow during the retrieval of passive avoidance. Color-coded overlays show statistically significant positive (red) and negative (blue) changes in conditioned compared to control rats (n = 11/group, P < 0.05 at the voxel level with extend threshold of 100 contiguous voxels). Structural brain images are from the template brain at representative bregma levels. Abbreviations: aINS (anterior insular cortex); AC (anterior commissure); NAcc (n. accumbens); APir (amygdalopiriform transition area); BLA (basolateral amygdaloid n.); Cg1, Cg2 (cingulate cortex, area 1 and area 2); dHPC (dorsal hippocampus); DMPAG (dorsomedial periaqueductal gray); fmi (forceps minor of the corpus callosum); lCPu (lateral caudate putamen); LS (lateral septal n.); M1 (primary motor cortex); PMCo (posteromedial cortical amygdaloid n.); PLCo (posterolateral cortical amygdaloid n.); PrL (prelimbic cortex); RS (retrosplenial cortex); S1 (primary somatosensory cortex); S2 (secondary somatosensory cortex); Abbreviations are based on the Paxinos and Watson (2007) rat brain atlas with modifications for simplification.

