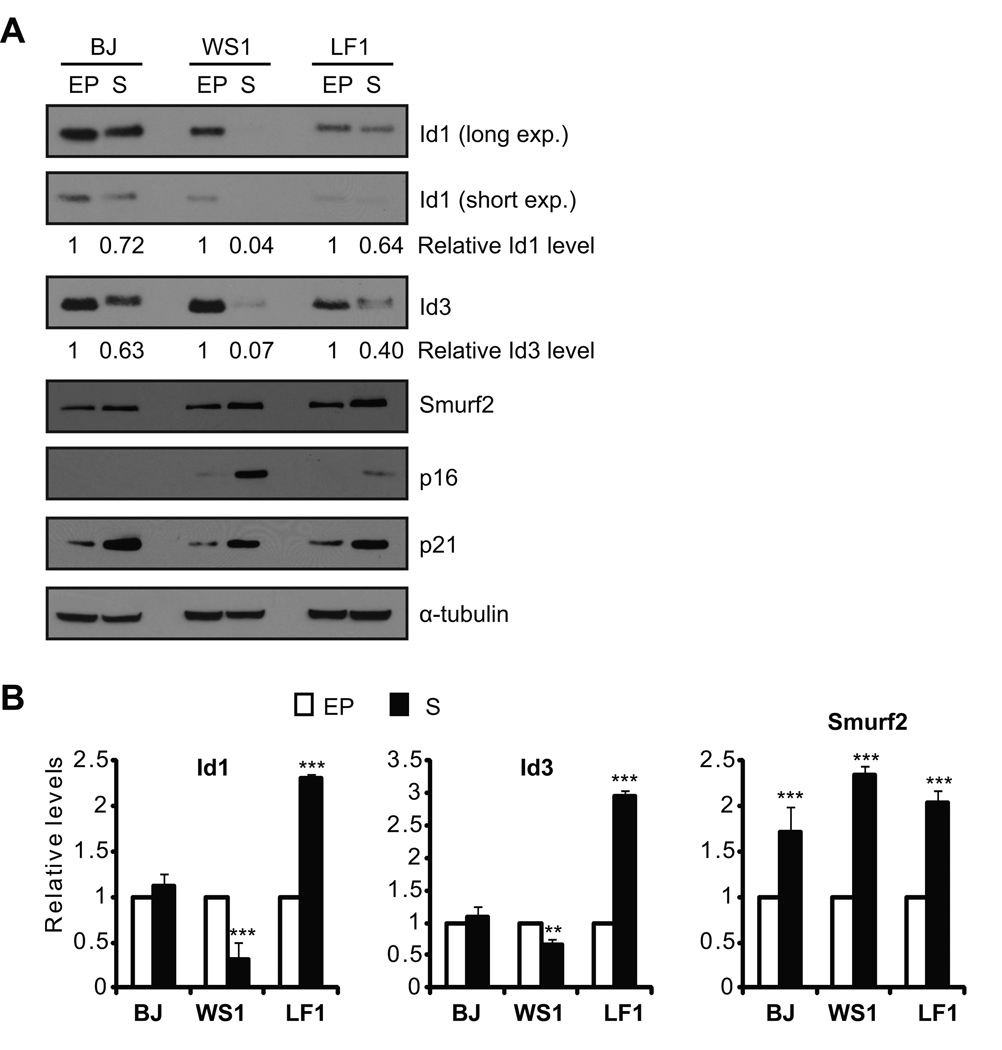
Fig. 1.
Decreased expression of Id1 and Id3 in senescent cells. (A) Western blot and (B) quantitative RT-PCR analyses of Id1, Id3 and Smurf2 in early passage (EP) and senescent (S) human fibroblasts. Id1 or Id3 proteins were quantitated using NIH ImageJ, and normalized with α-tubulin. Relative Id1 or Id3 protein levels in early passage cells were set to be 1. Relative transcript levels of Id1, Id3 or Smurf2 in early passage cells were set to be 1 after normalization with β-actin. Error bars were calculated from standard deviations of at least three independent experiments. Two-tailed and unpaired Student t–test was used in statistical analysis, and statistic significance is indicated as: * (P<0.05), ** (P<0.01), and *** (P<0.001).

