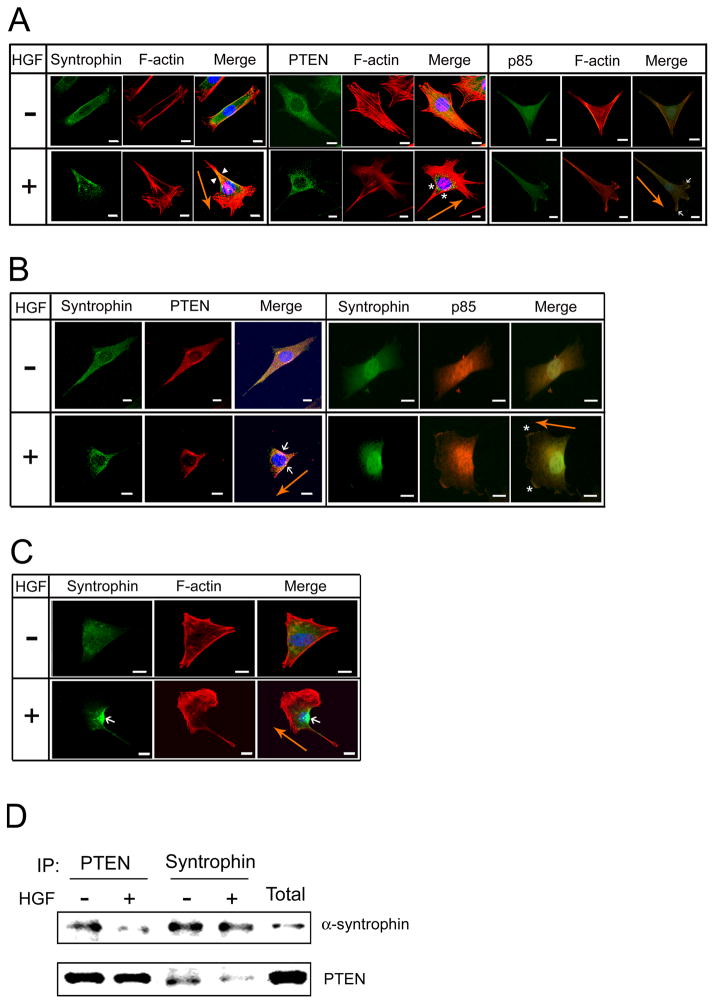
Fig 2. Syntrophins are localized at the trailing edge of the migrating cells.
(A) C2 myoblasts on coverslips were prepared as described in Fig 1. Cells were incubated with (+) or without (−) HGF (50 ng/ml) for 1 h and then labeled with anti-pan-syntrophin, anti-PTEN, or anti-p85 antibodies. Arrowheads and asterisks indicate syntrophin and PTEN in rear-lateral part of the cell, respectively. Arrows show p85 in lamellipodia of the cell. PTEN is used as a marker for the trailing edge whereas p85 is used for the lamellipodia at the leading edge of migrating cells. Rhodamine-phalloidin was used to stain F-actin (red). Fluorescence images were taken on a Zeiss LSM 510 confocal laser scanning microscope or Zeiss Axioskop 40 FL microscope. The scale bar indicates 10 μm. (B) Under the same culture conditions, cells were co-labeled with anti-pan-syntrophin and anti-PTEN antibodies, or anti-pan-syntrophin and anti-p85 antibodies. Arrows indicate co-localization of syntrophin and PTEN. Asterisks indicate p85 in lamellipodia. Bar is 10 μm. (C) C2 cells transfected with GFP fusion α-syntrophin were incubated with or without HGF (50 ng/ml). An arrow indicates GFP fusion α-syntrophin in rear-lateral part of the cell. To visualize the cytoskeleton and nuclei, cells were labeled with rhodamine-phalloidin (red) and DAPI, respectively. The scale bar indicates 10 μm. Orange arrow indicates the direction of cell migration. (D) Cells cultured as above were harvested for immunoprecipitation with anti-PTEN or anti-pan-syntrophin antibodies. The immunoprecipitated proteins were separated on SDS-PAGE and subjected to western blot analysis with anti-α-syntrophin or anti-PTEN antibodies. Lane ‘Total’ shows the western blot of the protein extract prior to immunoprecipitation and indicates the size of the expected proteins.

