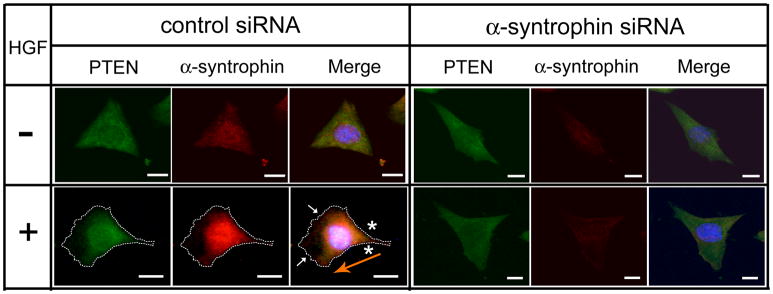
Fig 7. Localization of PTEN is disrupted in the α-syntrophin knock-down cells.
Cells grown on a 24-well tissue culture plates for 24 h were transfected with control siRNA or α-syntrophin-specific siRNA (100 nM) for 6 h. Cells were then incubated with (+) or without (−) HGF (50 ng/ml) for 1 h and were labeled with anti-α-syntrophin and anti-PTEN antibodies. Dotted line indicates shape of the cell. Small arrows indicate the lamellipodia of cells and the orange arrow indicates the direction of cell migration. Asterisks indicate co-localization of α-syntrophin and PTEN in the rear-lateral part of the cell. The scale bar is 10 μm.

