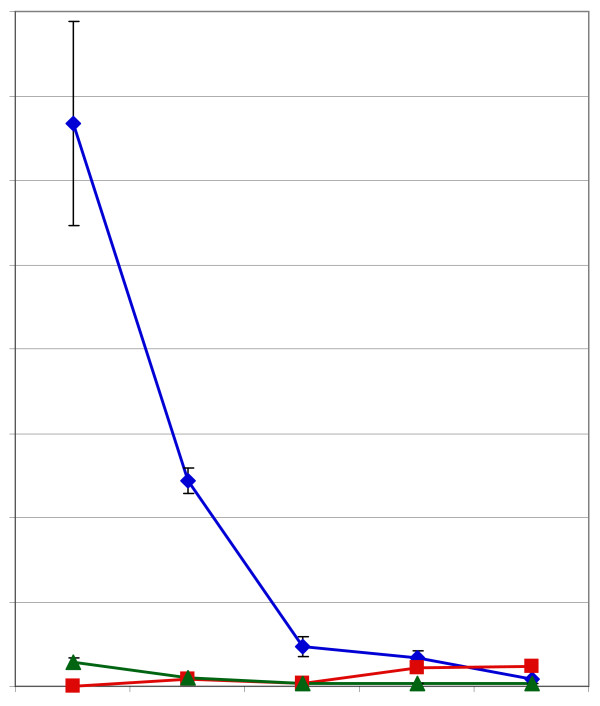
Figure 7.
Summary graph of the impact of processing on the flavan-3-ol content of cocoa beans. with exception of the ripe beans, all samples were commercial samples representative of the indicated processing stage. Blue diamonds = (-)-epicatechin, green triangles = (+)-catechin, red squares = (-)-catechin.

