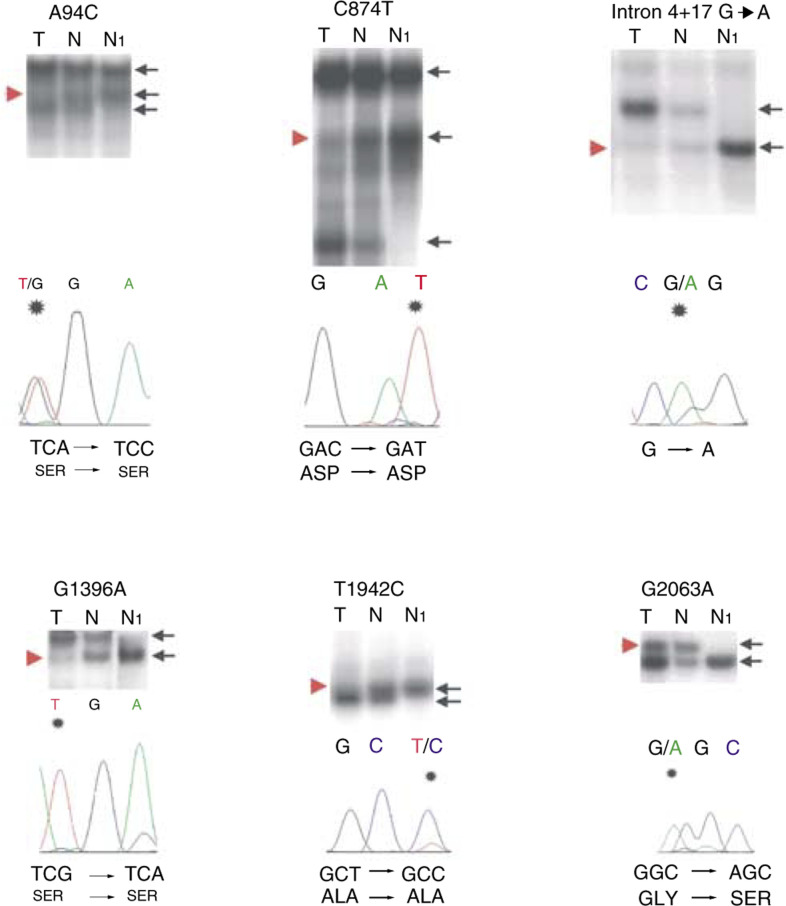
Figure 3.
PCR-SSCP and sequencing analyses of the SNPs in tumours (T) and corresponding normal DNA (N), compared with DNA from individuals without SNPs (N1). Informative cases with LOH are shown. Black arrows point to allelic patterns. Red arrow heads point to deleted alleles in the tumour DNA. The sequencing chromatograms below each autoradiograph show the alterations (note the substituted nucleotide marked by an asterisk), which all represent SNPs. SNPs A94C and G1396A are annotated in the reverse complementary direction, whereas the SNPs C874T, intron 4+17 G → A, T1942C and G2063A are annotated in the forward direction.

