
Figure 2.
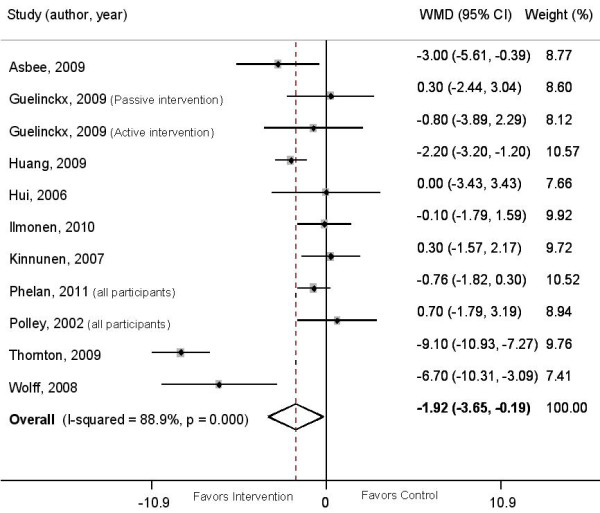
Weighted mean difference in total gestational weight gain between intervention and control groups. The overall effect size was estimated by weight mean difference using inverse variance method. Weights are from random effects analysis. The black dot represents the point estimate of each study, square size represents the weight of each study in the meta-analysis and the horizontal lines represent the respective 95%CI. The vertical solid line represents WMD of zero or line of no effect. The diamond represent the overall pooled estimate effect of the dietary intervention.