
Figure 3.
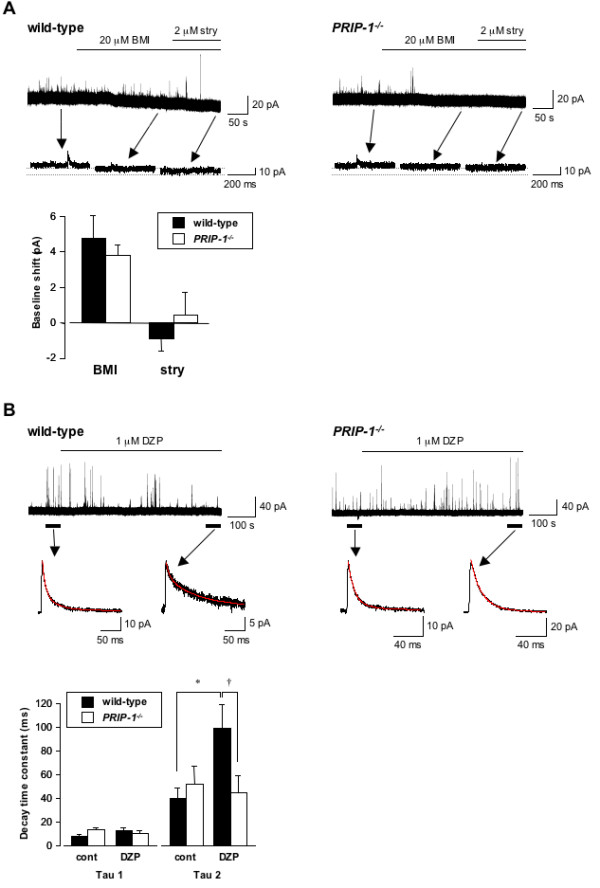
Inhibitory synaptic and extrasynaptic currents in SG neurons of PRIP-1 -/- mice and wild-type mice. (A) Representative traces and expanded traces for wild-type (left) and PRIP-1 -/- (right) showing the shift in baseline holding current elicited by 20 μM BMI and/or 2 μM strychnine (stry). The bar graph shows baseline shift elicited by 20 μM BMI (wild-type, n = 23; PRIP-1 -/- , n = 14) and/or 2 μM strychnine (wild-type, n = 6; PRIP-1 -/- , n = 6). BMI and strychnine were applied for 3-5 min in each experiment. (B) Representative traces and mean sIPSCs for wild-type (left) and PRIP-1 -/- (right) mice showing the sIPSCs elicited by 1 μM DZP. Tau is the decay time constant for the averaged trace of all sIPSCs recorded over 1 min in the absence or presence of DZP. DZP was applied for 8-10 min in each experiment. The red line in the averaged sIPSC trace shows the curve derived from a double-exponential equation. The bar graph shows summary of the tau data. Bars represent means and S.E.M. (*P < 0.05 vs. control, n = 6; †P < 0.05 vs. wild-type, n = 6).