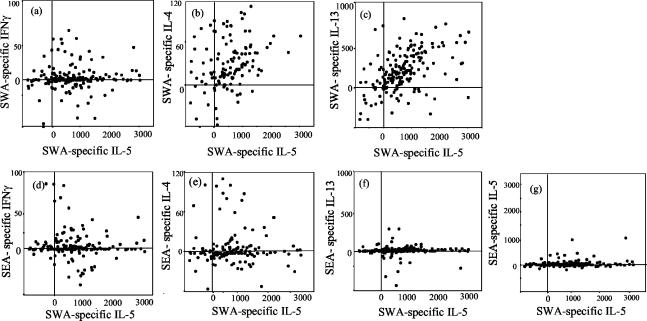
FIG. 2.
Scatter plots of SWA-specific IL-5 against other SWA- and SEA-specific cytokine responses. Specific cytokines were calculated by subtracting the level of each cytokine produced in the absence of Ag from that produced in the presence of either SEA or SWA for each individual. Cytokines were measured in picograms per milliliter, except for IFN-γ, which was measured in units per milliliter. Values for specific cytokine production are shown for each individual, whether above or below zero.

