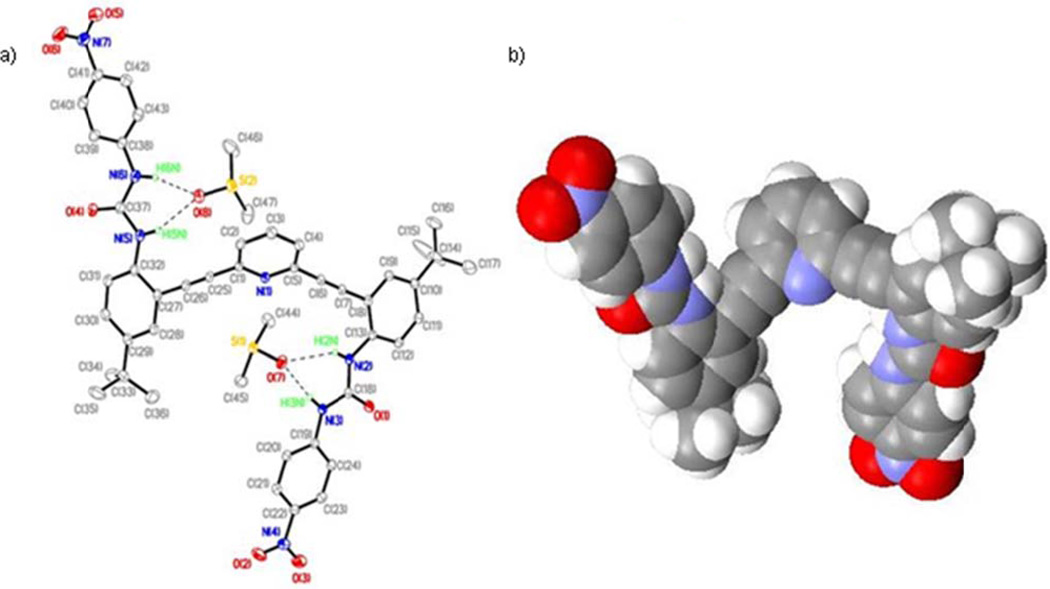
Figure 1.
(a) ORTEP diagram of L1•2DMSO with 30% thermal ellipsoids showing H-bonds between L1 and solvent molecules (dashed lines). Hydrogen atoms not involved in H-bonds are omitted for clarity. The O(7)⋯N(2), O(7)⋯N(3) and O(8)⋯N(5), O(8)⋯N(6) distances are 3.122(2), 2.757(2) and 2.935(3),2.790(3)Å, respectively;(b) space-filling model of the backward “S” conformation of L1 in L1•2DMSO.

