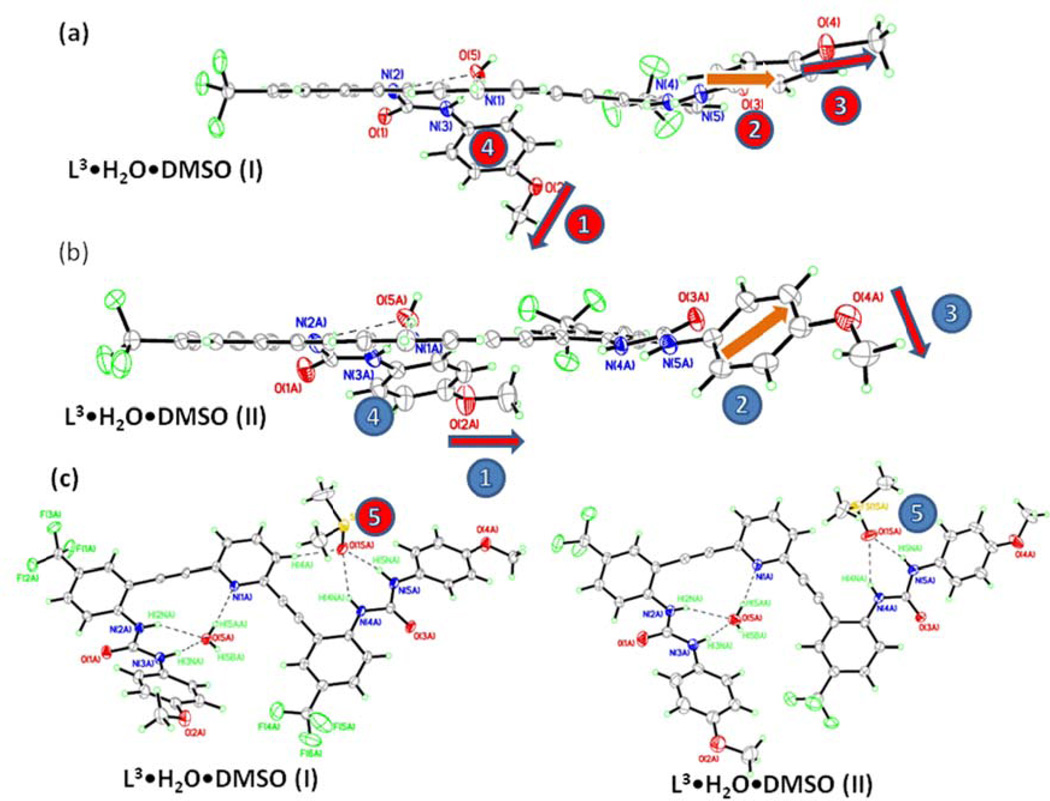
Figure 10.
ORTEP diagrams showing the differences between L3•H2O•DMSO complexes I (a, red labels) and II (b, blue labels). The numerical labels are: 1) methoxy groups on urea bound to water; 2&4) phenylurea orientation, 3) methoxy groups on urea bound to DMSO; 5) DMSO guest; c) ORTEP comparisons of I and II showing the different orientations of the DMSO guest (5).

