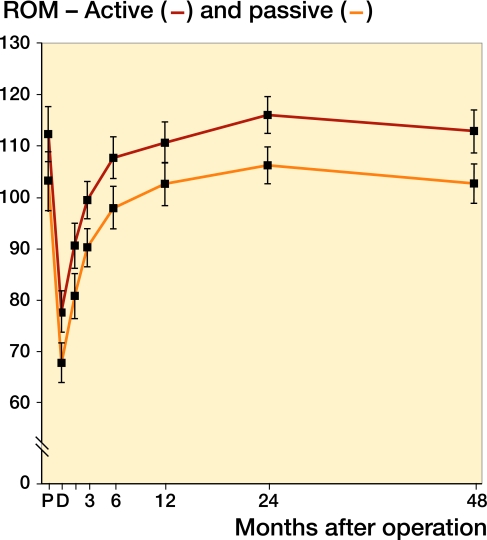
Figure 6.
Graph showing improvement in active ROM (red line) and passive ROM (blue line) with time. Values are mean ± CI. Pairwise comparisons for active ROM revealed statistically significant differences between values at discharge from hospital and at all other time points (p < 0.001), between values at 6 months and 1 year (p = 0.004), between values at 6 months and 2 years (p < 0.001), and between values at 6 months and 2 years (p = 0.001). Pairwise comparisons for passive ROM revealed statistically significant differences between values at discharge from hospital and at all other time points (p < 0.001), between values at 6 months and 2 years (p < 0.001), and between values at 1 year and 2 years (p = 0.005). P: preoperatively; D: discharge from hospital.

