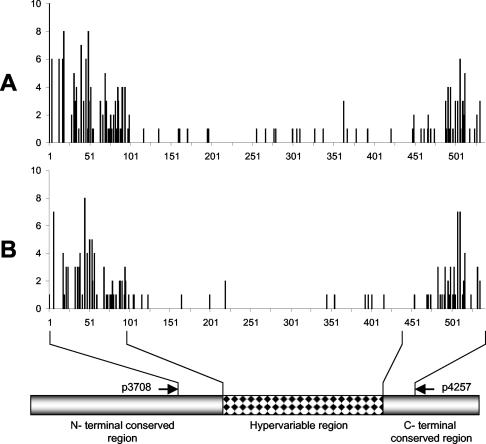
FIG. 4.
Frequencies of base differences in cDNA (NTN-1 and Westchester strains) and DNA (HZ strain) sequences of individual p44 genes among the same and different strains. (A) Differences within the same strain. The vertical axis shows combined frequencies of differences at each base position for each p44 species within each strain. The eight p44 species that showed the most frequent differences in sequences (p44-12 [2 for the Westchester strain and 5 for the NTN-1 strain], p44-14 [6 for the NTN-1strain], p44-16 [4 for the Westchester strain and 12 for the NTN-1 strain], p44-24 [6 for the NTN-1 strain], p44-30 [2 for the Westchester strain and 12 for the NTN-1 strain], p44-40 [4 for the NTN-1 strain], p44-51 [2 for the Westchester strain and 3 for the NTN-1 strain], and p44-53 [2 for the Westchester strain and 2 for the NTN-1 strain]) were aligned with the Clustal V program and compared within each p44 species in each strain. (B) Differences among different strains. A single representative sequence was selected for each p44 species in each strain. The cDNA and DNA sequences were aligned and base differences were compared with the majority at each nucleotide position. The vertical axis shows combined frequencies of differences at each base position for each p44 species among strains (35 NTN-1 strain cDNAs, 24 Westchester strain cDNAs, and 40 HZ strain DNAs, for a total of 99 sequences). The horizontal axis indicates the base positions after alignment.

