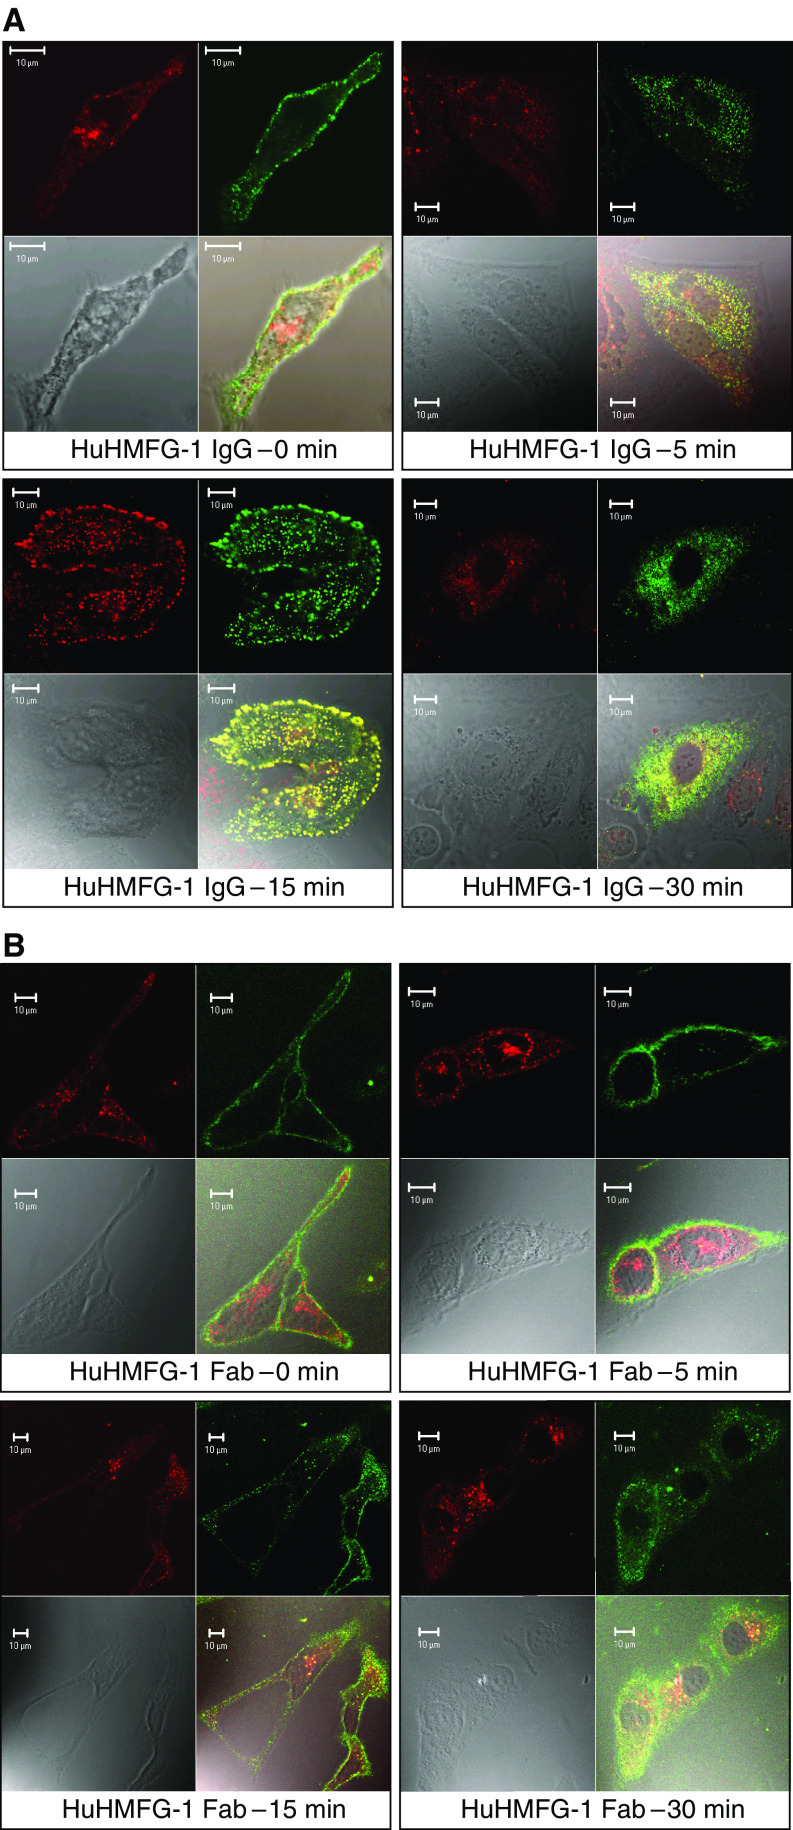
Figure 7.
Confocal immunofluorescent binding of HuHMFG-1 (A) IgG and (B) Fab to MCF-7 breast cancer cells. (A) Time course of binding for the IgG detected with anti-Fab FITC (green – upper right panel of each time point). The endosomal compartment of the same cells is visualised with transferrin-Alexa Fluor 594 (red – upper left panel of each time point). The transmission image is shown for each cell (lower left panel of each time point) and the superimposed image is shown for each time point (lower right panel for each time point). (B) The same experiment represented the same way for the Fab. The Zeiss LSM 510 software calculates fluorescence colocalisation with a coefficient of 1 meaning completely overlapping signals. For the green and red signals, these values are seen to increase with time, peaking at 15 min where the colocalisation is maximal. Higher colocalisation is seen for the whole IgG. The values are as follows: IgG: 0 min=0.16, 5 min=0.34, 15 min=0.79, 30 min=0.55. Fab: 0 min=0.12, 5 min=0.22, 15 min=0.42, 30 min=0.23).

