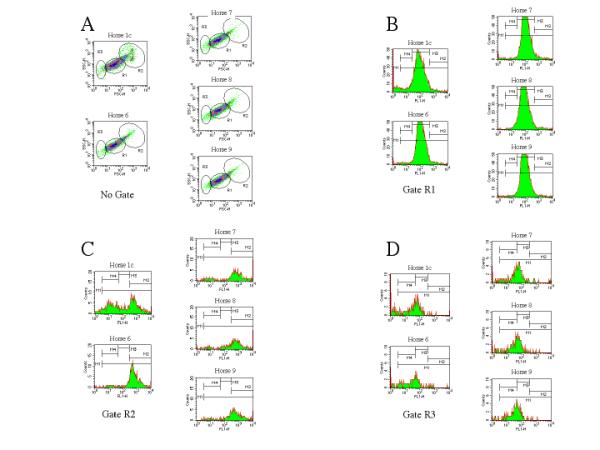
Figure 6.

Flow cytometric representation of morphological and fluorescent 1 (FL 1) signal of platelets of Horse 1 three weeks after new episode of thrombocytopenia and comparison with four healthy horses. Figure 6A. Density plots of ungated platelets from a thrombocytopenic and four normal horses. A set of panels displaying the FSC × SSC density plot of platelets derived from four healthy horses (Horse 6-9) are showed. The upper left panel of figure 6A represents the FSC × SSC density plots of thrombocytopenic Horse 1c. The gates R1, R2 and R3 are showed in each panel. Figure 6B. Histogram plots of the fluorescence signal carried by platelets delimited within gate R1.The evaluation of the presence of platelet associated IgG (PaIg) was determined by performing histogram analysis of the fluorescence carried by the platelets gated into R1. Markers M1, M2, M3 and M4 were drawn within the histogram plots. Markers are identical to the displayed in Figure 2 Figure 6C. Histogram plots of the fluorescence signal carried by platelets delimited within gate R2. PaIg was determined by performing histogram analysis of the fluorescence carried by the platelets gated into R2. Markers M1, M2, M3 and M4 are identical to the displayed in Figure 3 Figure 6D. Histogram plots of the fluorescence signal carried by platelets delimited within gate R3. PaIg was determined by performing histogram analysis of the fluorescence carried by the platelets gated into R3. Markers M1, M2, M3 and M4 are identical to the displayed in Figure 4.
