
Figure 4.
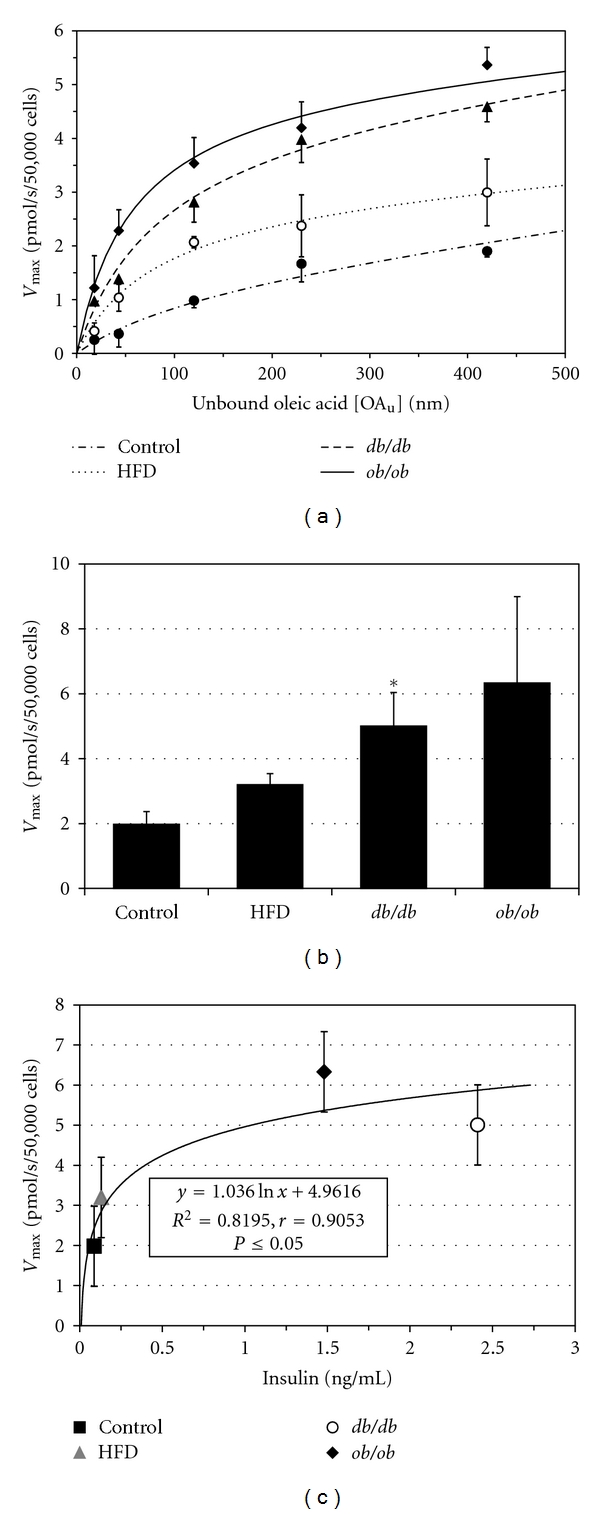
(a) [3H]-oleic acid uptake curves for cardiomyocytes from control, HFD, db/db, and ob/ob mice. Data points are mean ± SE. (b) Vmax for saturable cardiomyocyte LCFA uptake is increased in all obesity groups compared with the control group. Bars represent mean ± 1 SE. *indicates P < 0.05 compared to controls. (c) Relationship between serum insulin concentration and [3H]-oleic acid uptake Vmax, indicating a significant nonlinear correlation which may reflect, in part, insulin resistance.