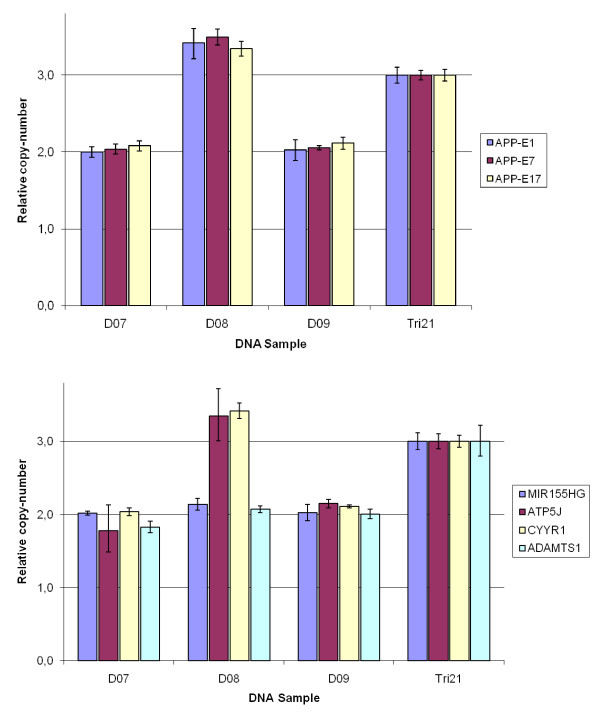
Figure 2.
Bar graph showing copy-number from the copy-number assay targeting APP exons (top) and genes flanking APP gene (lower). On the y-axis is the copy-number calculated relative to trisomy 21-DNA control, and on the x-axis are three patient DNA samples, D07, D08, D09 and the trisomy-21 DNA (Tri21). For top graph, three different assays at the APP locus were used, positioned in Exon1, (blue), Exon7 (red), and in Exon17 (yellow).). For lower graph, four different assays were used targeting the genes of; MIR155HG, (blue), ATP5J (red), CYYR1 (yellow), and ADAMTS1 (light blue). Assays were performed in tetraplicate and bars are shown as mean ±standard deviation.

