
Figure 4.
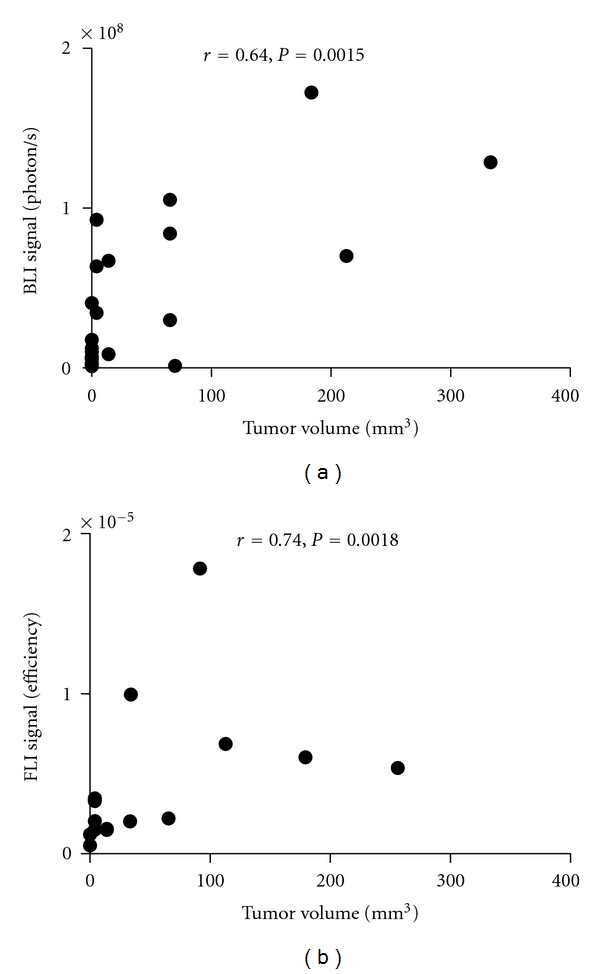
Tumor optical signal correlates with tumor volume calculated from caliper measurement. Data shown are BLI detection of luciferase-expressing tumors (n = 22, left) and FLI detection of RFP-expressing tumors (n = 15, right) in shaved mice. Only tumors displaying an optical signal above the background are shown. Tumors were derived from 4 mice each for BLI and for FLI. Tumors were imaged and tumor sizes were measured at various time points. Optical signal and tumor volume were compared using Spearman correlation.