Figure 3.
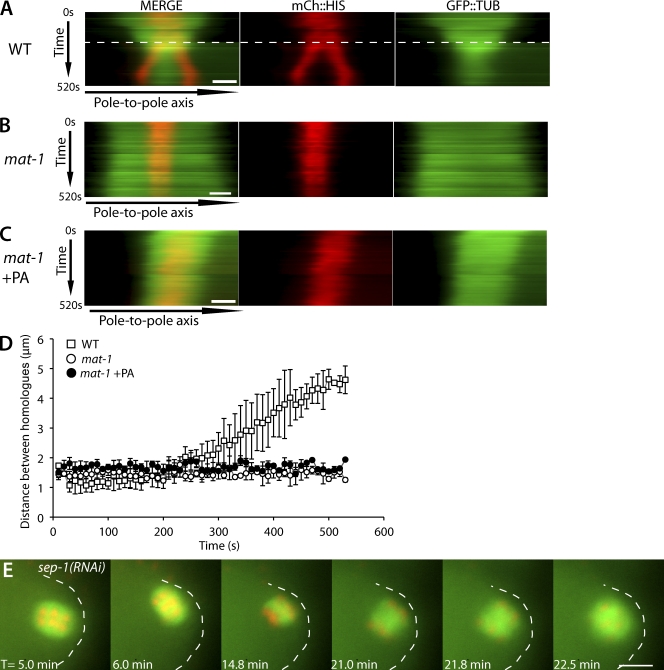
Inhibition of CDK-1 does not result in homologous chromosome separation. (A–C) Kymographs from live time-lapse image sequences. For each kymograph, a line was drawn along the pole-to-pole axis (x axis), and each kymograph was compiled from 52 images taken at 10-s intervals, totaling 520 s (y axis). T = 0 started when chromosomes aligned at the metaphase plate and the distance between homologues could be measured. Images are from worms expressing mCherry::histone and GFP::tubulin comparing wild type (WT; A), mat-1(RNAi) (B), and mat-1(RNAi) + PA (C). The dashed line in wild type indicates the time of rotation in which the pole-to-pole axis line had to be repositioned because of the change in spindle position. Bars, 2 µm. (D) Quantification of distance between homologous chromosomes in wild type (n = 6), mat-1(RNAi) (n = 4), and mat-1(RNAi) + PA (n = 6). Each data point represents the mean distance measured between homologues for each time point. Error bars represent one standard deviation greater than and less than the mean. The y axis is the distance between homologous chromosomes. (E) Representative live time-lapse sequence of meiotic spindle rotation in sep-1(RNAi) embryos expressing GFP::tubulin and mCherry::histone (n = 5/5). T = 0 starts at the exit from the spermatheca. The embryo cortex is outlined for clarity. Bar, 5 µm.

