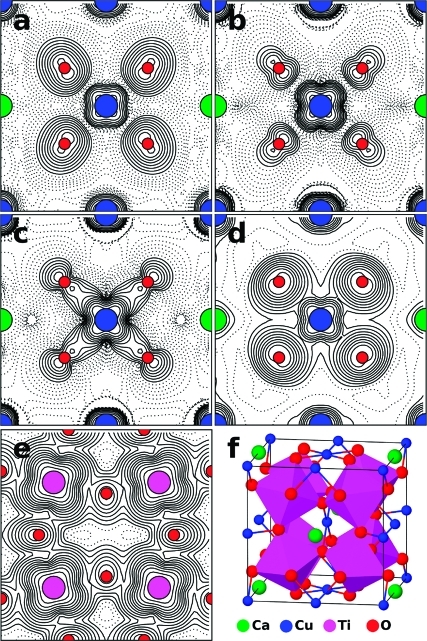
Figure 6.
Plots of electron densities arising from (a) the three occupied Cu(3d)−O(2p) σ-antibonding states at the top of the valence band, (b) the three unoccupied Cu(3d)−O(2p) σ-antibonding states forming the narrow band above the valence band, (c) the three occupied Cu(3d)−O(2p) σ-bonding states just below the valence band, and the unoccupied conduction band showing the contribution from (d) Cu 3d and O 2p orbitals and (e) the Ti 3d orbitals. Densities are plotted in the plane at the base of the unit cell depicted in (f), except for (e), which is plotted in the plane containing Ti atoms, one-fourth of the way up the unit cell. Note that calculations were actually performed in a unit cell with the origin at a Ca atom, but the plots have been shifted by half a unit cell along the y direction to make the CuO4 group central. Plots are made with logarithmic contours which are shown dashed below an arbitrary value.

