FIG. 1.
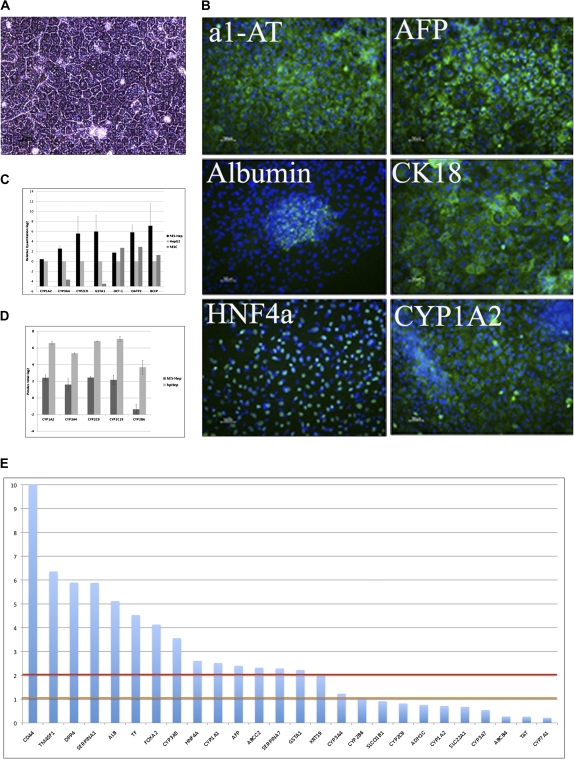
Hepatocyte-like characteristics of hES-Hep. (A) Phase contrast microscopy demonstrating the typical hES-Hep morphology after 22 days of differentiation. (B) Cells were positive for hepatocyte markers, such as α1-AT, AFP, albumin, CK18, HNF4α, and CYP1A2. (C) qPCR gene expression of hES-Hep show an expression of CYP1A2, CYP3A4, CYP2C9, OCT1, OATP2, GSTA1, and BCEP in comparison with HepG2 and undifferentiated hESC. Y-axis shows log2 values relative to HepG2 and hESC (n = 4). (D) CYP activity of CYP1A2, CYP3A4, CYP2C9, CYP2C19, and CYP2B6 further supporting that these cells are hepatocyte-like. Y-axis scale is Pmoles total log2 (n = 3). hpHep = human primary hepatocytes cultured for 48 h. (E) Significance of gene expression of hepatic markers in untreated hES-Hep. Y-axis displays the negative log10 of the detection p values of the gene expression signals. Horizontal lines indicate the 0.1 (orange) and 0.01 (red) detection levels.

