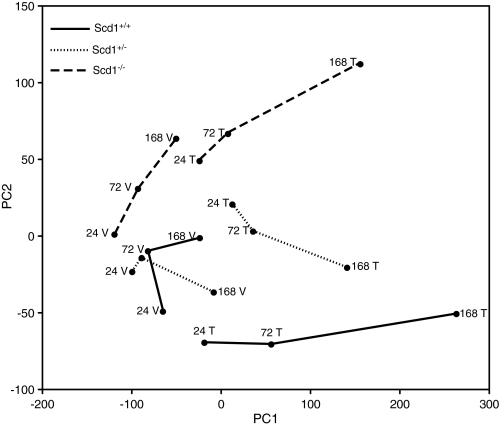
FIG. 2.
PCA of GC-MS lipid profiles from TCDD (T) or Vehicle (V) treated Scd1+/+, Scd1+/−, and Scd1−/− mice 24, 72, and 168 h postdose. PCA was performed in R as described in the “Materials and Methods.” PC1 and PC2 accounted for 95% of the cumulative proportion of the variance with vehicles clustering along PC1, treated groups separating along PC1, and genotype separating along PC2. Dashed lines (Scd1−/−), dotted lines (Scd1+/-), solid lines (Scd1+/+), n = 5 biological replicates.

