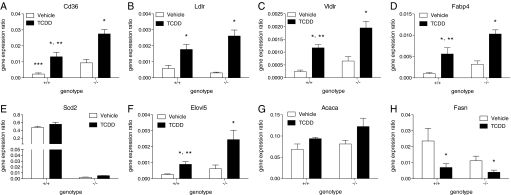
FIG. 4.
QRTPCR of hepatic lipid transport, modification, and biosynthesis genes in Scd1+/+ (+/+) and Scd1−/− (−/−) mice gavaged with 30 μg/kg TCDD or sesame oil vehicle for 24 h. The gene expression ratio is the total quantity normalized to the geometric mean of Hprt, Actb, and Gapdh mRNA levels. Genes are indicated by official gene symbols. Error bars represent the SEM, n = 5. *, p < 0.05 for TCDD compared with vehicle within a genotype; **, p < 0.05 for Scd1+/+ TCDD compared with Scd1−/− TCDD; ***, p < 0.05 for Scd1+/+ vehicle compared with Scd1−/− vehicle. Data were analyzed by factorial ANOVA followed by Tukey’s post hoc test.

