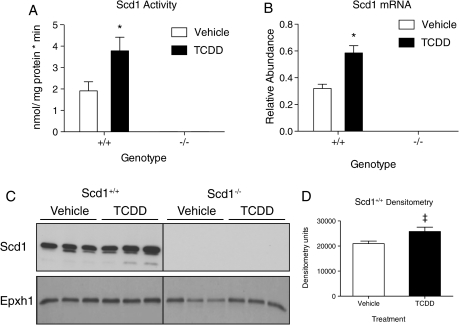
FIG. 5.
Scd1 activity, mRNA, and protein levels in Scd1+/+ and Scd1−/− mice treated with 30 μg/kg TCDD (T) or sesame seed oil (V) 24 h postdose. (A) Scd1 activity. Hepatic microsomes (100 μg, n = 5) isolated from mice were incubated with 0.03 μCi 14C-stearoyl-CoA (14C 18:0), NADH, and stearoyl-CoA. 14C 18:0 was separated from 14C 18:1 by silver ion chromatography and radioactivity measured by scintillation counting. Scd1 activity is expressed as nmol 14C 18:0 converted to 14C 18:1 per mg Scd1 protein per min. (B) QRT-PCR of Scd1 mRNA (n = 5). Expression is represented as a ratio of the total quantity of Scd1 normalized to the geometric mean of Hprt, Actb, and Gapdh. (C) Scd1 Western blot. Hepatic Scd1 protein (n = 3) was detected in 10 μg of microsomes. Epxh1 was used as a microsomal protein reference for loading control. (D) Densitometry. Densitometry was determined with ImageJ from Scd1 bands and normalized to Ephx1 bands. ‡ p = 0.08. For A, B, and D bars represent mean ± SEM, *, p < 0.05 for T compared with V within a genotype; **, p < 0.05 for Scd1−/− T compared with Scd1+/+ T within a time point; ***, p < 0.05 for Scd1−/− V compared with Scd1+/+ V within a time point. Data were analyzed by factorial ANOVA followed by Tukey’s post hoc test.

