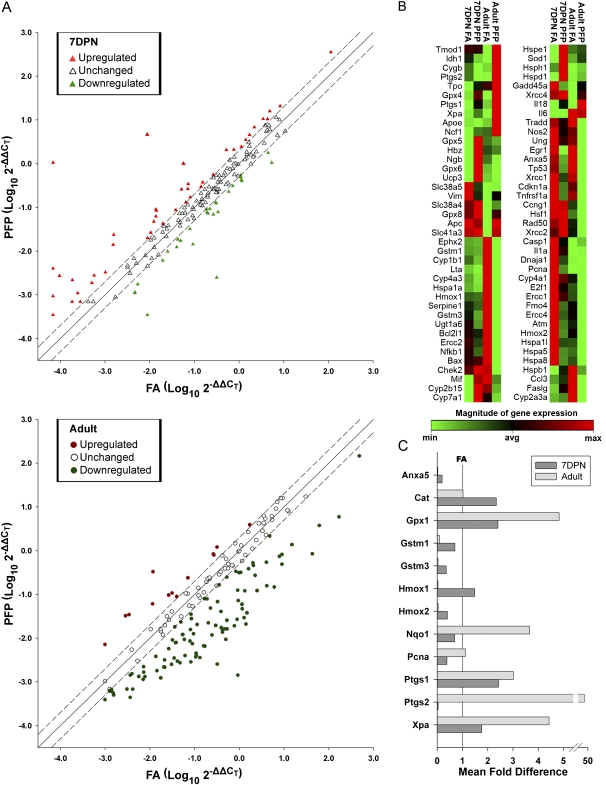
FIG. 5.
Differentially expressed genes in microdissected airways. (A) Scatterplot of analyzed genes as a function of log of fold change plotted against exposures with FA on the x-axis and PFP on y-axis. The solid regression line indicates no exposure-induced change in the gene, and dashed lines are the 2 fold cutoff points. Genes expressed in neonates (top) are represented as triangles, where upregulated expression is colored pink, unchanged in white, and downregulated in lime. Gene expression in adults (bottom) are presented as circles, where upregulated genes are red, unchanged in white, and downregulated in green. Overall, neonates and adults have a divergent response. A trend showing upregulation was present in neonates (pink triangles), while adult animals were observed to have a substantial number of downregulated genes (green circles). (B) Heatmaps for all differentially expressed genes in airways of rats as a combination of age and/or exposure. All age and treatment groups were compared against FA exposed 7-day postnatal (7DPN) rats to elucidate age and exposure effects using HPRT as the reference gene. Genes that were differentially expressed at a p value less than 0.05 are shown (n = 3–6 rats/group). The relative magnitude of expression is indicated on a spectrum ranging from minimum (green) to maximum (red) detected. Expression patterns in 78 genes differed significantly as a combination of age and/or exposure effects. (C) The relative fold change compared with age-matched FA controls (line set at 1) for a subset of genes that were either significantly altered in 7-day-old postnatal and/or adult animals. Data are plotted as mean fold difference ± SEM (n = 3–6 rats/group, each rat was analyzed individually on the array).

