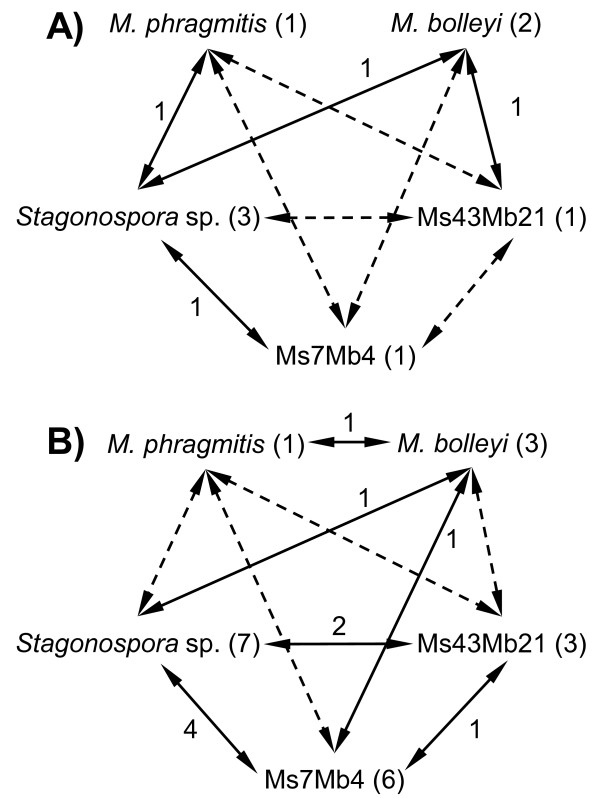
Figure 5.
Niche differentiations of five fungal species with respect to time and space. Summary of nested-PCR assays on 251 DNA preparations from tissue samples of P. australis. Pair-wise species comparisons were conducted using binomial tests with P <0.05. Straight arrows indicate variations that remained significant after Bonferroni corrections, broken arrows variations that were additionally significant when Bonferroni corrections were omitted. Numbers at the arrows give the incidences of significant results for a species pair and those in brackets for a given species, respectively. Numbers refer to Bonferroni-corrected comparisons. A) Seasonal variation by months; B) Spatial variation by host organ plus habitat-type.

