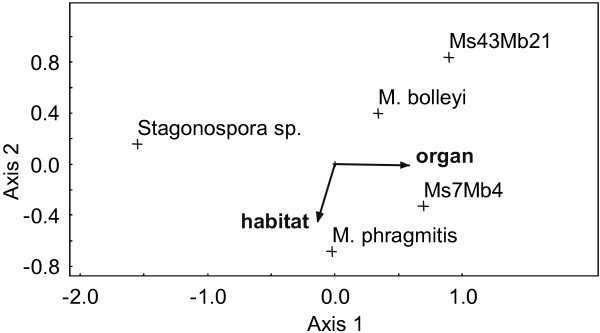
Figure 6.
Canonical correspondence analysis. CCA biplot ordination for the effects of space defined by plant organ and habitat type assessing five fungal species on reeds at Lake Constance. Axes 1 and 2 explain 32.9% and 5.5% of the variation, respectively. Monte Carlo permutation test on axis 1: P = 0.0010.

