Figure 1.

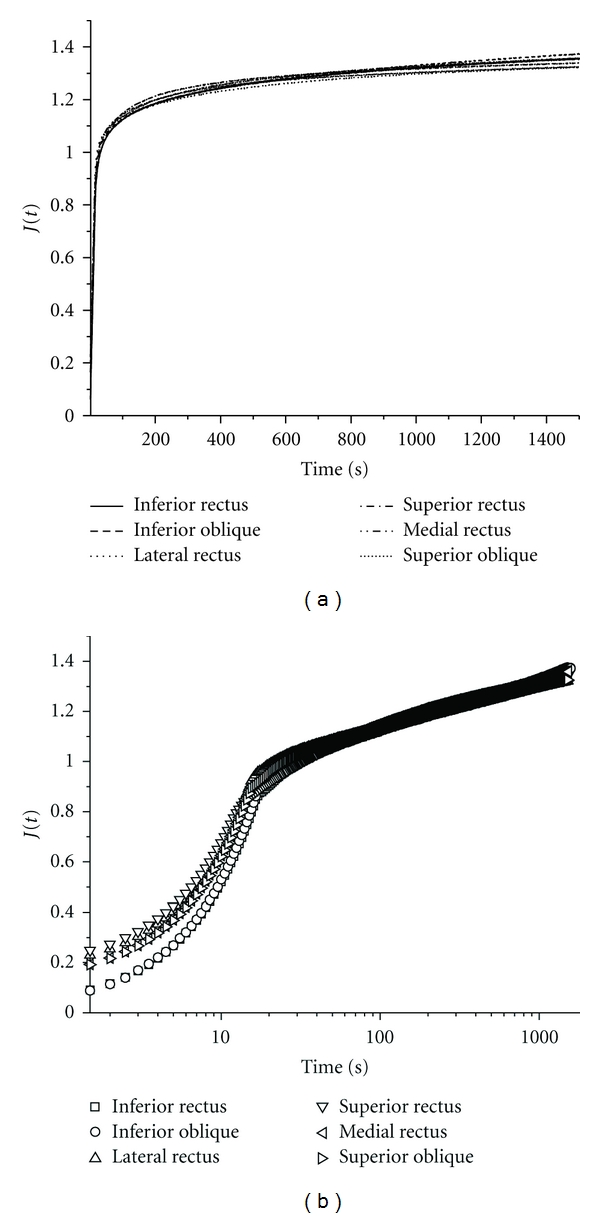
Mean normalized displacement J(t) plotted for two specimens each of the six bovine EOMs in both linear and semi-log scales. All EOMs exhibited similar creep to 1.34 ± 0.02 (SD) maximum.

Mean normalized displacement J(t) plotted for two specimens each of the six bovine EOMs in both linear and semi-log scales. All EOMs exhibited similar creep to 1.34 ± 0.02 (SD) maximum.