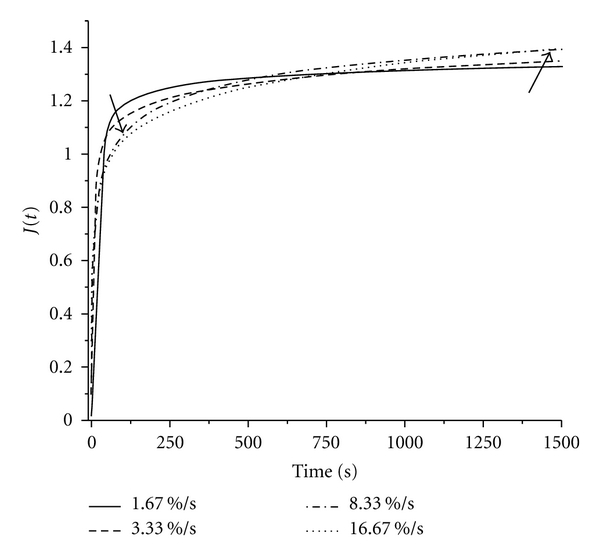
Figure 3.

Comparison of creep at 4 different initial loading rates. The left arrow indicates that a lower reduced creep coefficient is reached at the end of initial ramp loading as the ramp-loading rate increases. The right arrow indicates that a higher creep coefficient is reached after 1500 seconds as ramp-loading rate increases.
